
Buyer's Market vs. Seller's Market: What Each One Means for You

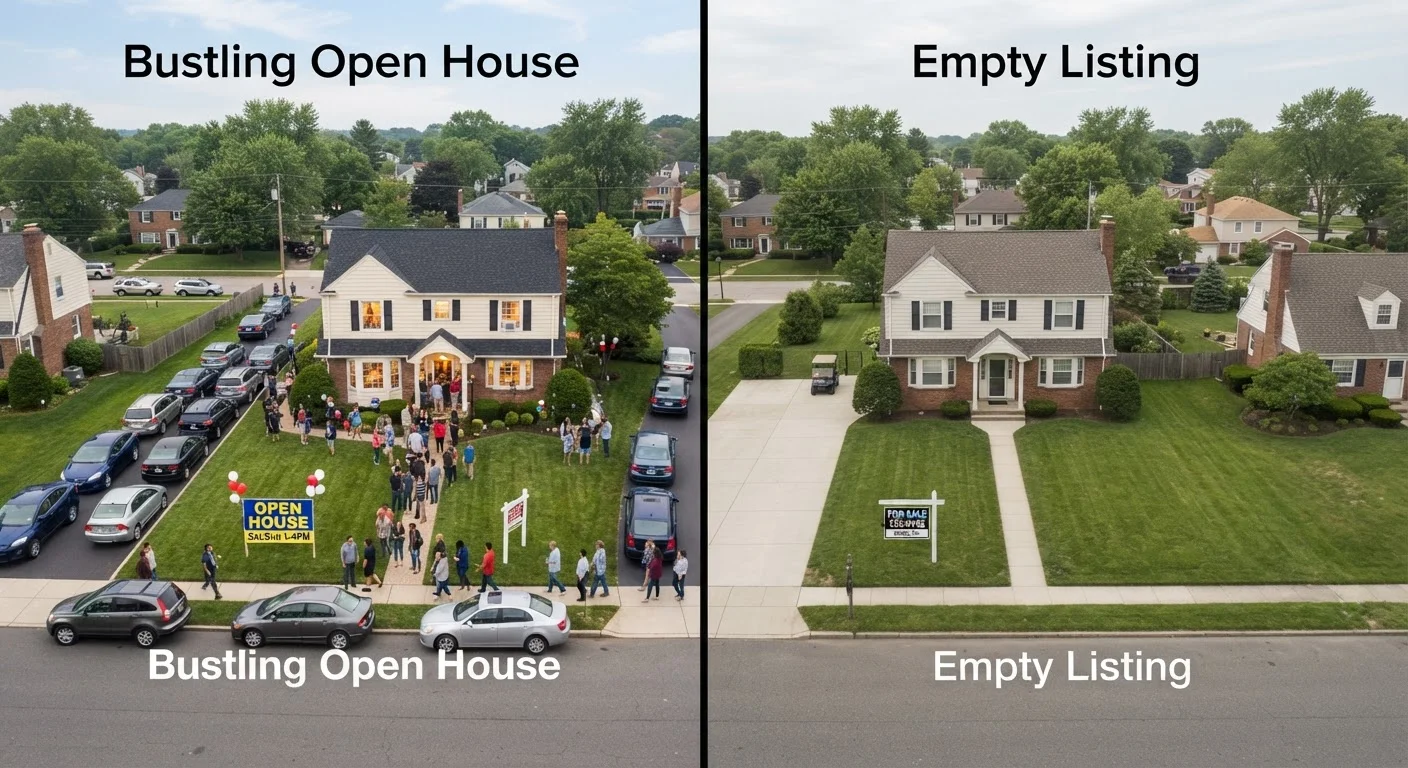
Photo: faqsvault.com editorial
Key Takeaways
- A buyer's market exists when housing supply exceeds demand, giving purchasers more leverage over price and terms.
- A seller's market emerges when demand outpaces supply, pushing prices up and shortening the time homes sit listed.
- Market type directly affects negotiating power, contingency options, and realistic timelines for both sides.
- Local conditions often differ sharply from national headlines — neighborhood-level inventory matters most.
- Understanding which market you're in helps set realistic expectations whether you're buying, selling, or waiting.
What Defines Each Market Type
At its core, the difference between a buyer's market and a seller's market comes down to one thing: supply versus demand. When there are more homes available than there are active buyers, purchasers hold the upper hand. When buyers outnumber available listings, sellers are in control. How the US housing market actually works involves a web of factors — from mortgage rates to new construction — but the buyer-seller balance is where those forces show up most visibly for everyday participants.
Real estate professionals commonly use months of supply as a measuring stick. This figure estimates how long it would take to sell every active listing at the current pace of sales, assuming no new homes enter the market. A general rule of thumb:
- Under 4 months of supply — seller's market conditions
- Around 5–6 months — balanced or neutral market
- Over 6 months — buyer's market conditions
These thresholds aren't universal laws, and local markets can diverge significantly from national averages. A city experiencing a major employer arrival may be deeply in seller's territory even while surrounding regions cool. Key terms like absorption rate and days on market help translate these dynamics into concrete numbers you can track in local reports.
| Criterion | Buyer's Market | Seller's Market |
|---|---|---|
| Inventory level | High — more homes than buyers | Low — more buyers than homes |
| Months of supply (typical) | 6+ months | Under 4 months |
| Negotiating power | Buyer holds leverage | Seller holds leverage |
| Average days on market | Longer — homes sit unsold | Shorter — homes sell fast |
| Offer price vs. asking price | Often below asking | Often at or above asking |
| Contingencies accepted | Common and expected | Frequently waived by buyers |
| Seller concessions | Closing costs, repairs typical | Rare or minimal |
| Price trends | Flat or declining | Rising |
How Each Market Affects Buyers
In a buyer's market, shoppers have options — and time. Homes linger on the market longer, which means you can tour multiple properties, sleep on a decision, and come back with a measured offer rather than a rushed one. Price reductions are common. Sellers are often willing to cover a portion of closing costs, agree to repairs after inspection, or accept contingencies — such as a home sale contingency, where you don't close until your current home sells — that they'd reject outright in a hotter market.
A seller's market flips those dynamics. Homes may receive multiple offers within days of listing. Buyers frequently waive inspection contingencies or appraisal gaps to make their offers more attractive, which carries real financial risk. Bidding wars can push the final sale price well above the asking price, and the emotional pressure to move fast can lead to decisions that don't hold up under cooler reflection. Common misreading mistakes often peak in seller's markets, where fear of missing out clouds judgment.
If you're trying to gauge where you stand right now, interpreting key housing indicators — including price-to-rent ratios and local inventory trends — can give you a clearer picture than national headlines alone.
How Each Market Affects Sellers
Sellers in a seller's market hold most of the cards. Listing prices trend higher, homes sell faster, and competing offers can drive the final price beyond expectations. Sellers can often decline contingencies, set aggressive timelines, and choose among multiple qualified buyers. For homeowners who have built equity and are ready to move, it's a favorable window to liquidate at a strong return.
But there's a catch: sellers are usually buyers too. If you're selling a home to purchase another in the same market, you'll face the same scarcity and bidding pressure on the buy side. This tension is one reason many homeowners feel stuck even in strong markets — they worry about where they'll go after they sell.
In a buyer's market, sellers face longer listing periods and softer offers. Strategic pricing matters more: listing too high can cause a property to stagnate, and a stale listing often signals to buyers that something is wrong, even when the issue is simply mispricing. Sellers may need to invest in presentation — staging, repairs, professional photography — to distinguish their home in a crowded field. Understanding what drives neighborhood property values can also help sellers make the case for their asking price.
Why Local Context Beats National Averages
National market reports set context but rarely dictate your specific situation. The US housing market is not monolithic — it's thousands of overlapping local markets, each shaped by employment trends, migration patterns, zoning policy, and housing stock age. Sun Belt and Rust Belt housing markets illustrate just how dramatically conditions can diverge across regions.
A metro area might broadly be labeled a seller's market while specific zip codes within it — perhaps those with aging infrastructure or limited school options — behave more like buyer's markets. Conversely, a nationally cooling market may still have hyper-competitive pockets near transit corridors or employment hubs.
The practical takeaway: before calibrating your expectations or strategy, research months of supply, median days on market, and sale-to-list price ratios specifically for the neighborhoods you're targeting. Your agent, local MLS data, or county assessor reports can provide this granularity. National trend pieces are informative context — not a substitute for block-level data.
This article is for general informational and educational purposes only. It does not constitute financial, legal, or real estate advice. Readers should consult a licensed real estate professional for guidance specific to their situation and local market.
All published content on this website is for informational and educational purposes only and should not be taken as professional advice. We recommend that readers seek expert opinion before making any decisions. The website is not responsible for any actions taken based on the information provided on this website. We are not liable for any inaccuracies, modifications, or omissions in information. Moreover, external links or third-party content are provided for convenience; we are not liable for their correctness. Users are advised to verify every piece of information before they use it for any purpose.