
Reading the Market: How to Tell Whether It's a Better Time to Buy or Wait

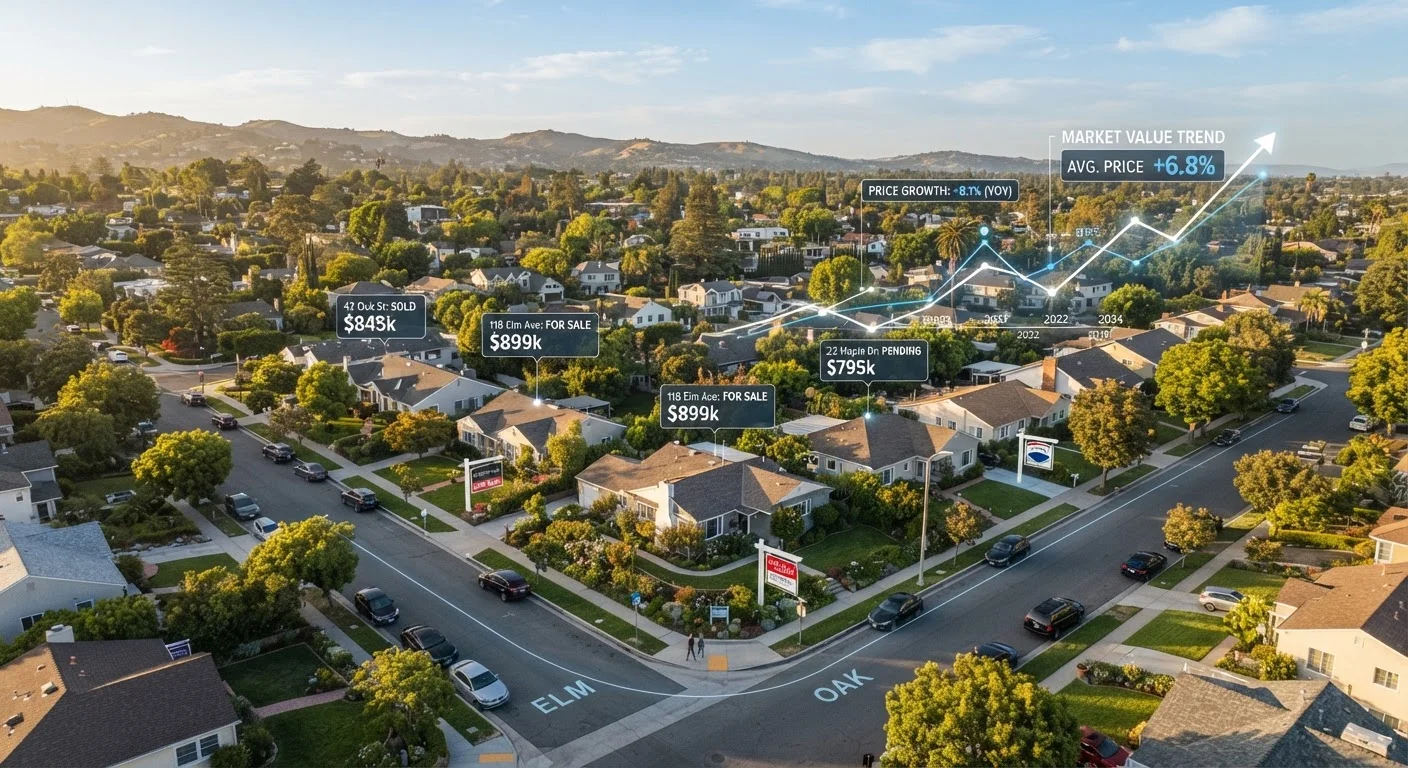
Photo: faqsvault.com editorial
Key Takeaways
- No single indicator tells the whole story — effective market reading combines multiple data points.
- Mortgage rates affect monthly payments significantly, but local inventory and price trends matter just as much.
- The price-to-rent ratio helps you compare the relative cost of owning versus renting in a specific area.
- Personal financial readiness often matters more than trying to time the market perfectly.
- Local market conditions can differ sharply from national averages — always look at your specific metro.
Why Market Conditions Matter — But Aren't Everything
Deciding whether to buy a home or keep renting is one of the largest financial decisions most people will make. Market conditions — interest rates, home prices, rental costs, inventory — are all legitimate inputs into that decision. But chasing a perfect moment to buy is a strategy that often backfires. The most useful approach is learning to read the signals clearly so that your decision reflects actual conditions, not headlines or anxiety.
For a broader foundation, the rent-or-buy trade-offs article digs into the financial and lifestyle factors alongside market timing. What follows here focuses specifically on how to interpret the market data itself.
6 months
Supply threshold signaling a buyer's market
Housing analysts generally use six months of supply as the dividing line between balanced and buyer-favorable conditions, per industry convention used by the National Association of Realtors.
5–7 years
Typical break-even horizon for homeownership
Real estate economists commonly estimate that buyers need to stay in a home for at least five to seven years to recover transaction costs through equity gains and appreciation.
~$200/mo
Payment impact of a 1% rate increase
On a $350,000 loan, a one-percentage-point rise in the 30-year fixed mortgage rate adds roughly $200 per month to the principal and interest payment.
Key Indicators to Track
Mortgage Rates
The 30-year fixed mortgage rate is the most widely cited indicator for good reason: it directly determines monthly payment size. A rate difference of even one percentage point on a $350,000 loan translates to roughly $200 per month in payment difference. When rates rise sharply, buyer demand tends to cool, which can soften prices — but it also means higher carrying costs for anyone who does buy.
Watching rate trends matters more than any single rate snapshot. If rates have recently peaked and are trending down, affordability may improve ahead. If they're climbing, acting sooner may lock in a lower payment. Neither direction guarantees a better outcome, since home prices often move inversely to rate changes.
Inventory Levels
The number of homes actively listed for sale — and how quickly they're selling — tells you a great deal about market power. Low inventory means sellers can hold firm on price and expect multiple offers. Higher inventory shifts negotiating leverage toward buyers. The standard benchmark is months of supply: how long it would take to sell all listed homes at the current pace. Below 4 months is typically a seller's market; above 6 months favors buyers.
The housing inventory levels article provides a detailed walk-through of how to interpret months of supply, new construction starts, and active listing trends.
Price-to-Rent Ratio
This ratio compares the purchase price of a home to the annual cost of renting a comparable property. Divide the purchase price by annual rent to get the ratio. A ratio of 15 or below generally suggests buying is financially competitive with renting. Between 15 and 20 is a gray zone where personal factors dominate. Above 20 indicates that renting may be more cost-efficient — at least over a shorter time horizon.
Keep in mind that this ratio varies significantly by city. Markets like San Francisco or New York can have ratios well above 30, while Midwestern metros often sit closer to 12–14. Applying a national average to a local decision can mislead more than it helps, which is a point explored in the common market misreading pitfalls article.
Buyer's Market vs. Seller's Market — and the Gray Zone Between
Experienced market watchers know that conditions are rarely cleanly one or the other. A city can have a seller's market in entry-level homes and a buyer's market in luxury properties simultaneously. Seasonal slowdowns can create temporary buyer-friendly windows even within generally competitive markets.
Understanding the full spectrum of market types — and how each affects your negotiating position, offer strategy, and price expectations — is foundational knowledge. The buyer's market vs. seller's market explainer covers this in depth. In practical terms, the most important question to ask isn't "is this a good market?" but rather "what does this specific market mean for a buyer at my price point and in my target neighborhood?"
Reading the Data Without Getting Lost
Monthly housing reports from organizations like the National Association of Realtors, the Census Bureau, and various regional MLS groups provide raw data on median prices, days on market, sale-to-list price ratios, and more. These reports are worth consulting — but require careful interpretation.
Median sale price, for instance, can shift based on what types of homes are selling, not just whether values are rising or falling. A surge in luxury home sales will pull the median up without indicating that mid-range homes appreciated. Days on market can reflect seasonality as much as demand. The housing market report reading guide walks through which metrics carry the most signal in a given environment.
For anyone using listing descriptions as part of their research, the property listing interpretation article explains how to decode the language agents use — and what it often omits.
What Personal Readiness Has to Do With It
Even in a textbook buyer's market, purchasing a home when you're financially overextended or planning to move within two years is likely a poor decision. Transaction costs — agent commissions, closing costs, moving expenses — typically run 8–10% of the purchase price when you account for both buying and eventual selling. It generally takes five or more years of ownership to recover those costs through equity building and appreciation.
A realistic self-assessment covers: credit score and borrowing eligibility, available down payment, emergency reserves after closing, job stability, and expected length of stay. These factors don't eliminate the value of market awareness — but they do determine whether favorable market conditions can actually be acted on. The Property Basics hub provides foundational context for first-time buyers working through these questions.
This article is for general informational and educational purposes only and does not constitute financial, investment, or legal advice. Readers should consult a qualified financial adviser or real estate professional regarding their specific circumstances before making property decisions.
Frequently Asked Questions
All published content on this website is for informational and educational purposes only and should not be taken as professional advice. We recommend that readers seek expert opinion before making any decisions. The website is not responsible for any actions taken based on the information provided on this website. We are not liable for any inaccuracies, modifications, or omissions in information. Moreover, external links or third-party content are provided for convenience; we are not liable for their correctness. Users are advised to verify every piece of information before they use it for any purpose.