
The US Housing Market: A Complete Guide to How It Evolves

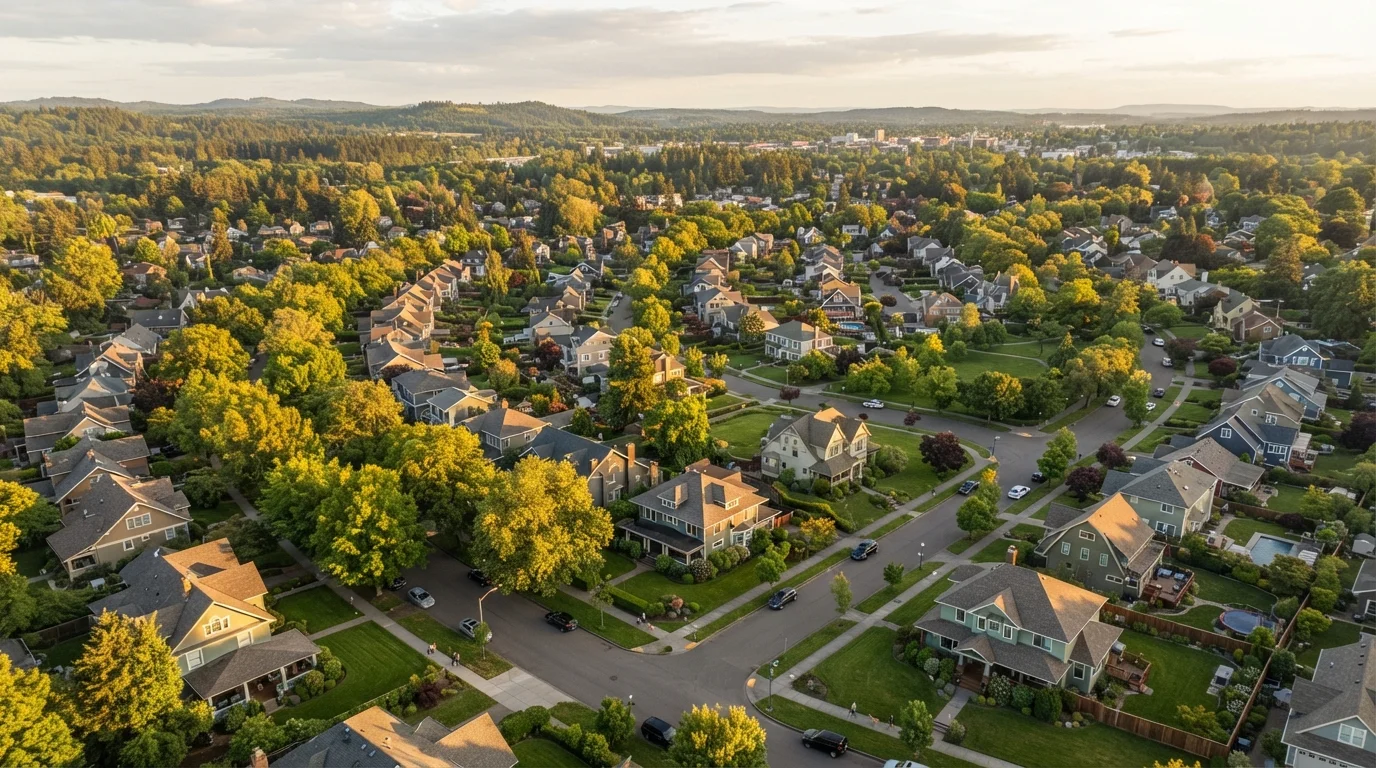
Photo: faqsvault.com editorial
Key Takeaways
- Post-war suburbanization, federal mortgage policy, and demographic shifts collectively built today's housing landscape.
- Interest rates, inventory levels, and local job markets are the three most consequential drivers of home prices.
- National housing headlines often mask wide variation between individual metros and neighborhoods.
- The pandemic triggered price surges and migration patterns whose effects continue to ripple through the market.
- Understanding key metrics helps everyday readers evaluate market conditions without relying on sensational media framing.
How American Housing Got Here: A Brief History
The modern US housing market did not emerge organically — it was shaped by deliberate policy choices, infrastructure investment, and shifting cultural values across more than a century. Understanding those layers helps explain why housing behaves the way it does today.
The post-World War II era was transformative. The GI Bill's mortgage guarantees, combined with federally subsidized highway construction, made suburban homeownership accessible to millions of returning veterans and their families. Developers like Levitt & Sons mass-produced affordable single-family homes, and the car-centric suburb became the dominant American living arrangement almost overnight.
Through the 1970s and 1980s, inflation, oil shocks, and high interest rates made housing volatile. The savings-and-loan crisis of the 1980s wiped out hundreds of lending institutions and tightened credit availability. By the 1990s, a tech-driven economic expansion and looser lending standards reignited demand.
The 2000s brought the most consequential chapter in modern housing history. Subprime mortgage products, weak regulatory oversight, and Wall Street's securitization of home loans inflated a nationwide bubble that collapsed between 2007 and 2012, erasing trillions of dollars in household wealth. That crisis still influences how regulators, lenders, and buyers approach risk today. For a grounding in the terms used to describe these cycles, see the glossary every housing market watcher needs.
The Core Forces That Move the Market
At its foundation, housing is a supply-and-demand market — but several interconnected forces complicate that simple framing. For a thorough plain-language breakdown, the guide on how the US housing market actually works covers these dynamics in depth.
Mortgage interest rates are the single most immediate lever on affordability. When rates rise, monthly payments on the same loan balance increase significantly, pricing some buyers out of the market and slowing sales volume. When rates fall, purchasing power expands and competition intensifies.
Housing inventory — the number of homes available for sale — determines how much power buyers or sellers hold. A low-inventory market tips toward sellers; a high-inventory market gives buyers more negotiating room. Inventory is influenced by new construction, homeowner mobility, and the willingness of existing owners to sell.
Local employment and income growth underpin long-run demand. Metros with strong, diversified job markets tend to sustain housing demand even when national conditions weaken. Conversely, areas dependent on a single employer or industry can see sharp price corrections when that economic anchor falters.
When evaluating whether a market is cooling or heating, watch the months-of-supply figure before the median price — inventory shifts lead price changes by several months.
Don't conflate a drop in sales volume with a drop in prices — in low-inventory markets, transaction counts can fall sharply while prices remain firm or rise.
Demographic trends — particularly the aging of the large millennial generation into prime homebuying years — add persistent structural demand that has supported prices even during periods of elevated rates.
National Trends vs. Local Realities
One of the most common mistakes housing watchers make is treating national data as a reliable guide to what is happening in their own backyard. The US housing market is not a single market — it is thousands of overlapping local markets, each with its own supply constraints, zoning rules, employer base, and migration patterns.
A metro like Austin, Texas experienced extraordinary price appreciation during the early 2020s driven by tech-sector migration, then saw meaningful price corrections as that wave normalized and new supply entered the market. Meanwhile, markets like Hartford, Connecticut or Buffalo, New York remained relatively stable throughout the same period precisely because they had not overheated.
~40%
US Median Home Price Increase, 2020–2022
Federal Reserve data indicates national median home prices rose roughly 40 percent between early 2020 and mid-2022, an historically unusual pace.
3.8M
Estimated National Housing Unit Shortfall
Research from the National Association of Realtors and other analysts has estimated a multi-million unit housing deficit built up over the past decade of underbuilding.
20+ years
Mortgage Rate Peak After Fed Hikes
After the Federal Reserve's 2022–2023 rate-hiking cycle, 30-year fixed mortgage rates reached levels not seen in more than two decades.
Zoning policy is a key local variable that national headlines rarely capture. Municipalities that restrict multifamily development or impose lengthy permitting processes constrain supply regardless of demand levels, keeping prices elevated. Those that welcome denser development tend to see more moderate price trajectories over time.
When evaluating a market, readers should look beyond the headline median home price and consider metrics like months of supply, days on market, and the ratio of list price to sale price. These indicators reveal the actual competitive dynamics on the ground.
The Pandemic Era and Its Lasting Imprint
The COVID-19 pandemic compressed years of potential housing market change into roughly 24 months. Several forces collided simultaneously: record-low mortgage rates driven by Federal Reserve policy, a surge in remote-work adoption that decoupled residence from office location, a sharp drop in for-sale inventory as existing homeowners delayed moves, and stimulus-supported household savings that boosted down-payment capacity.
The result was an unprecedented price surge. National median home prices rose by roughly 40 percent between early 2020 and mid-2022, according to Federal Reserve data — a pace with few historical precedents outside of the pre-2008 bubble era.
When the Federal Reserve raised interest rates aggressively starting in 2022 to combat inflation, mortgage rates climbed from near-historic lows to their highest levels in two decades. This created what many housing economists describe as a lock-in effect: homeowners with low-rate mortgages became reluctant to sell and trade into higher-rate debt, further constricting inventory even as demand softened.
The Lock-In Effect Is Constraining Supply
Migration patterns also shifted durably. Sun Belt metros, mountain West cities, and lower-cost secondary markets gained residents from expensive coastal hubs. Whether those patterns persist or partially reverse as remote-work norms continue to evolve remains an open question — one worth watching through local market data rather than national averages.
What Shapes a Market's Future
Predicting housing markets with precision is not possible — too many variables interact in nonlinear ways. What is possible is identifying the structural forces that will influence conditions over the medium term.
Household formation drives baseline demand. As younger Americans move out of shared living situations and form independent households, they generate persistent need for rental and for-sale housing. Census-level projections on household formation provide a reasonable long-run demand signal.
Construction capacity determines whether supply can respond to demand. Labor shortages in the skilled trades, rising materials costs, land constraints in desirable metros, and complex regulatory environments have all contributed to a structural underbuilding of housing in many US markets over the past decade.
Climate risk is an increasingly material factor in where demand flows and where insurance costs rise. Coastal flood risk, wildfire exposure, and extreme heat are beginning to be priced into both property values and insurance premiums in affected areas.
For readers who want to probe the assumptions often made about future price trajectories, the article on common myths about US home prices is a useful check on widely held beliefs.
How to Read the Market Without Losing Perspective
Housing market reporting tends toward extremes — either triumphant headlines about record prices or alarming ones about imminent crashes. Neither framing serves readers who need to make real decisions about renting, buying, or staying put.
The most useful habit is grounding national headlines in local data. A city-level or even neighborhood-level picture of inventory, price trends, and days on market will tell you far more about your actual situation than a national median figure. Local REALTOR association reports, regional Federal Reserve branch publications, and municipal planning department data are underused but genuinely informative sources.
It also helps to separate short-run volatility from long-run fundamentals. Prices can move sharply in either direction over 12 to 24 months due to rate movements or sentiment shifts, while the underlying supply-demand balance in a given market may be pointing in a different direction entirely.
For practical guidance on interpreting the data you encounter, the guide on reading a housing market report without getting lost in the numbers walks through the metrics that matter most. And for those weighing the broader rent-versus-own decision, the Renting & Owning hub offers structured practical guidance.
This article is for general informational and educational purposes only. It does not constitute financial, investment, legal, or real estate advice. Readers should consult qualified professionals before making housing or financial decisions.
All published content on this website is for informational and educational purposes only and should not be taken as professional advice. We recommend that readers seek expert opinion before making any decisions. The website is not responsible for any actions taken based on the information provided on this website. We are not liable for any inaccuracies, modifications, or omissions in information. Moreover, external links or third-party content are provided for convenience; we are not liable for their correctness. Users are advised to verify every piece of information before they use it for any purpose.